
 Add to Chrome
Can AI Do Technical Analysis? GPT vs Claude vs Grok vs Kimi on a Bitcoin Chart
If you've ever asked ChatGPT about a trading chart, you've probably wondered: is AI chart analysis actually right, or does it just sound right?
So we tested it: GPT vs Claude vs Grok vs Kimi. Four AI models, one Bitcoin chart in TradingView, three rounds of questions, and every answer checked against the real numbers. The cheapest model kept up with the most expensive one. Only one of them called the double top.
We make SurfMind, the browser extension we ran the test in. This is educational content about AI tools, not financial advice. No answer here is a signal to buy or sell anything.
The short answer: which AI reads charts best?
| Model | Relative cost | Round 1: the basics | Round 2: RSI | Round 3: patterns |
|---|---|---|---|---|
| Grok 4.7 | 1× | ✓ | ✓ (took 4 min 47 s) | No clear pattern, both times |
| Kimi K3 | 2.5× | ✗ low in the wrong month | ✗ read the wrong number | A different pattern each time |
| Claude Opus 5.5 | 4× | ✓ | ✓ | Double top, both times |
| GPT-6 Astra | 10× | ✓ | ✓ | No clear pattern, both times |
- Best value: Grok 4.7. At 1×, it gave the same answers as GPT-6 Astra at 10×.
- Best chart reader: Claude Opus 5.5. The only one that called the double top.
- Kimi K3 answered from the wrong data twice, and changed its pattern when we asked again.
Relative cost is SurfMind's credit rate for each model on the day of the test (Grok 4.7 = 1×), not a measured cost per answer.
How we tested
- One chart for everything: Bitcoin (BTC/USD), daily candles, August 1, 2025 to January 31, 2026, with RSI(14) underneath, open in TradingView.
- The AI reads the page itself. We didn't upload a screenshot. SurfMind's read-active-page toggle (the book icon in the message box) was on, so each model looked at the chart in the open tab.
- Same questions, side by side. We asked GPT and Claude together, then Grok and Kimi, in SurfMind's compare view. Every prompt ended with "Keep it short."
- Asked twice where it matters. Round 3 (patterns) was asked twice, the second time in a new chat.
- Checked against the real numbers from the chart's own daily data.
One thing to know: the page also shows today's live Bitcoin price and RSI (about $75,600 and 37.7 on the day of the test), next to the past chart. That turned out to matter.
Round 1: Can AI read the basics?
We asked: "Look at the chart on this page. Is the price going up, down or sideways? What are the highest and lowest prices, and in which month?"
The real answer: down. High $126,230 on October 6. Low $75,787 on January 31, the last candle.
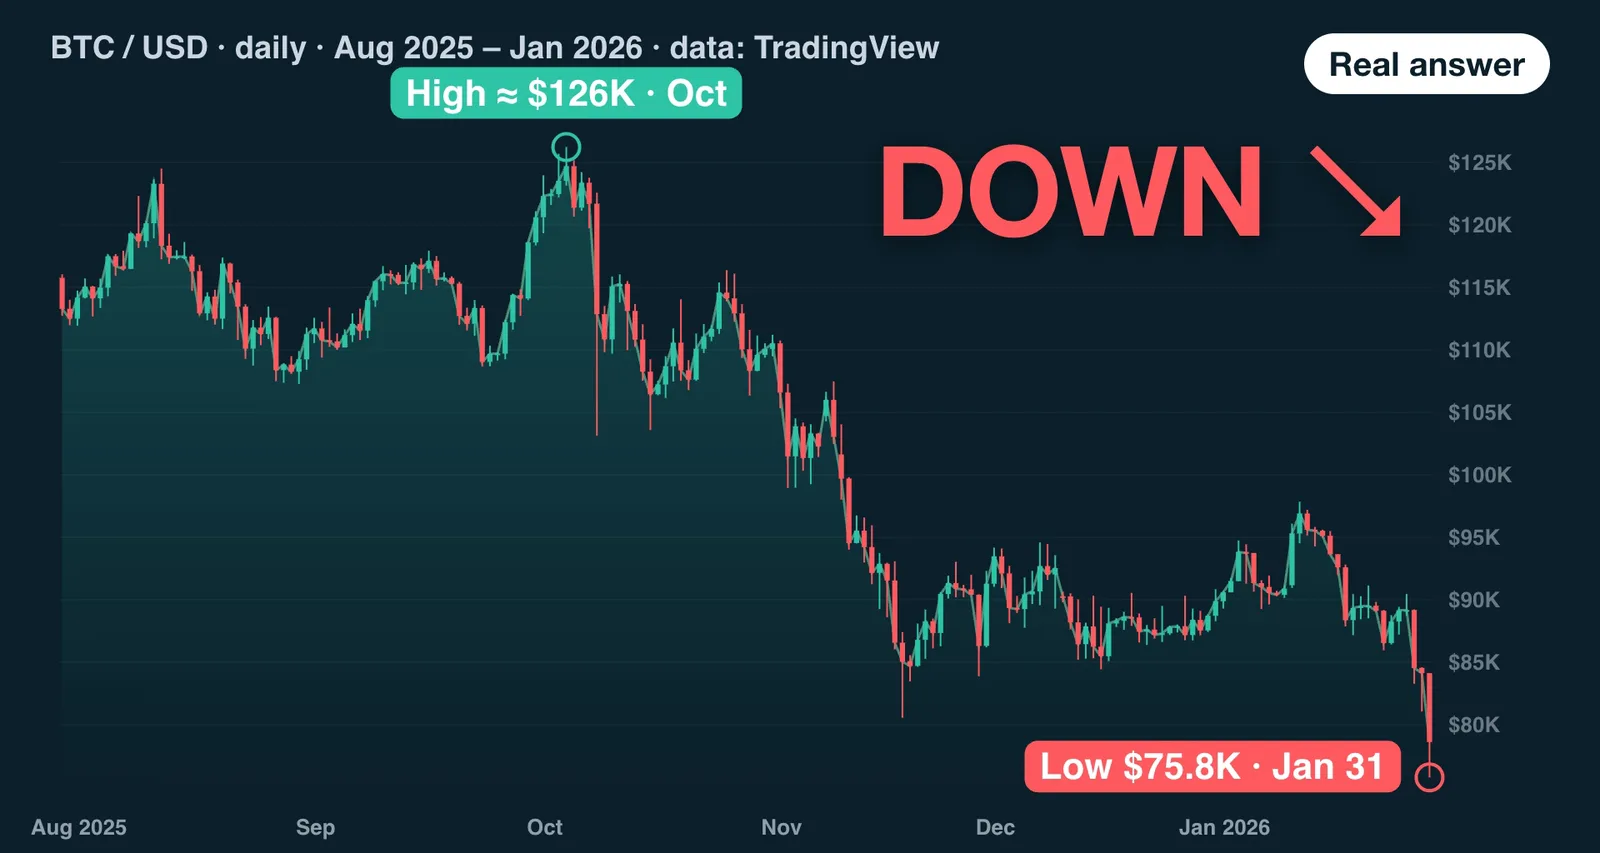
GPT, Claude and Grok all got it: down, about $126,000 in October, about $75,500–75,600 in January.
One catch: their "low" is almost exactly today's live price on the page, not the chart's low of $75,787. Grok even wrote "live price ~$75,630" next to it. Close enough to count, but it's a sign of what came next.
Kimi got the trend and the high, but put the low "around April 2026", a month that isn't on the chart.
Round 1: 3 out of 4.
Round 2: Can AI read an indicator?
We asked: "What is the RSI at the right edge of the chart? Is Bitcoin overbought, oversold or neither there?"
The real answer: about 25. Below 30 usually means oversold.
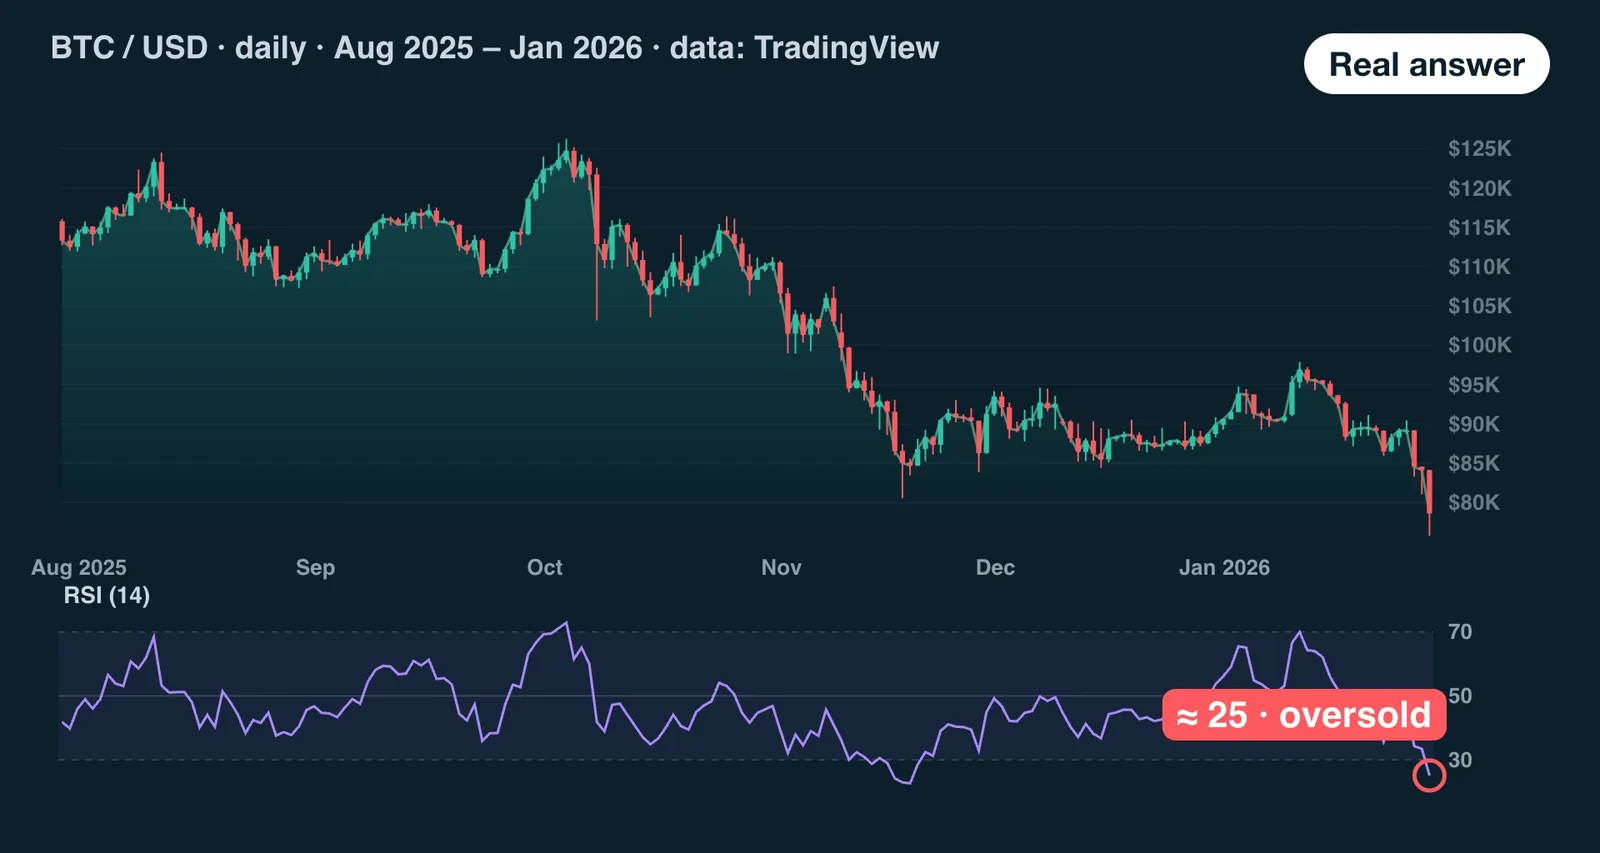
- GPT: about 24, oversold, in about 5 seconds.
- Claude: 24–25, oversold, in about 5 seconds.
- Grok: about 25, oversold. Right, but it took 4 minutes 47 seconds: it weighed the live RSI on the page against the chart and chose the chart.
- Kimi: 37.8, "neither overbought nor oversold". That's not this chart. It's close to today's live RSI on the page.
Round 2: 3 out of 4. Grok was right, just slow.
Round 3: Can AI spot a chart pattern?
We asked: "Do you see a classic chart pattern on this chart? If there is no clear pattern, say so." Then we asked again, in a new chat.
- GPT: "No clear, textbook chart pattern stands out." Then: "No clean textbook pattern stands out."
- Grok: "No clear classic pattern," both times.
- Claude: "Not a textbook pattern, but one comes close: a rough double top." Then: "Yes. The clearest pattern is a double top, and it has already played out."
- Kimi: a "rounding top", described with months that aren't on the chart. Then: "completed head and shoulders."
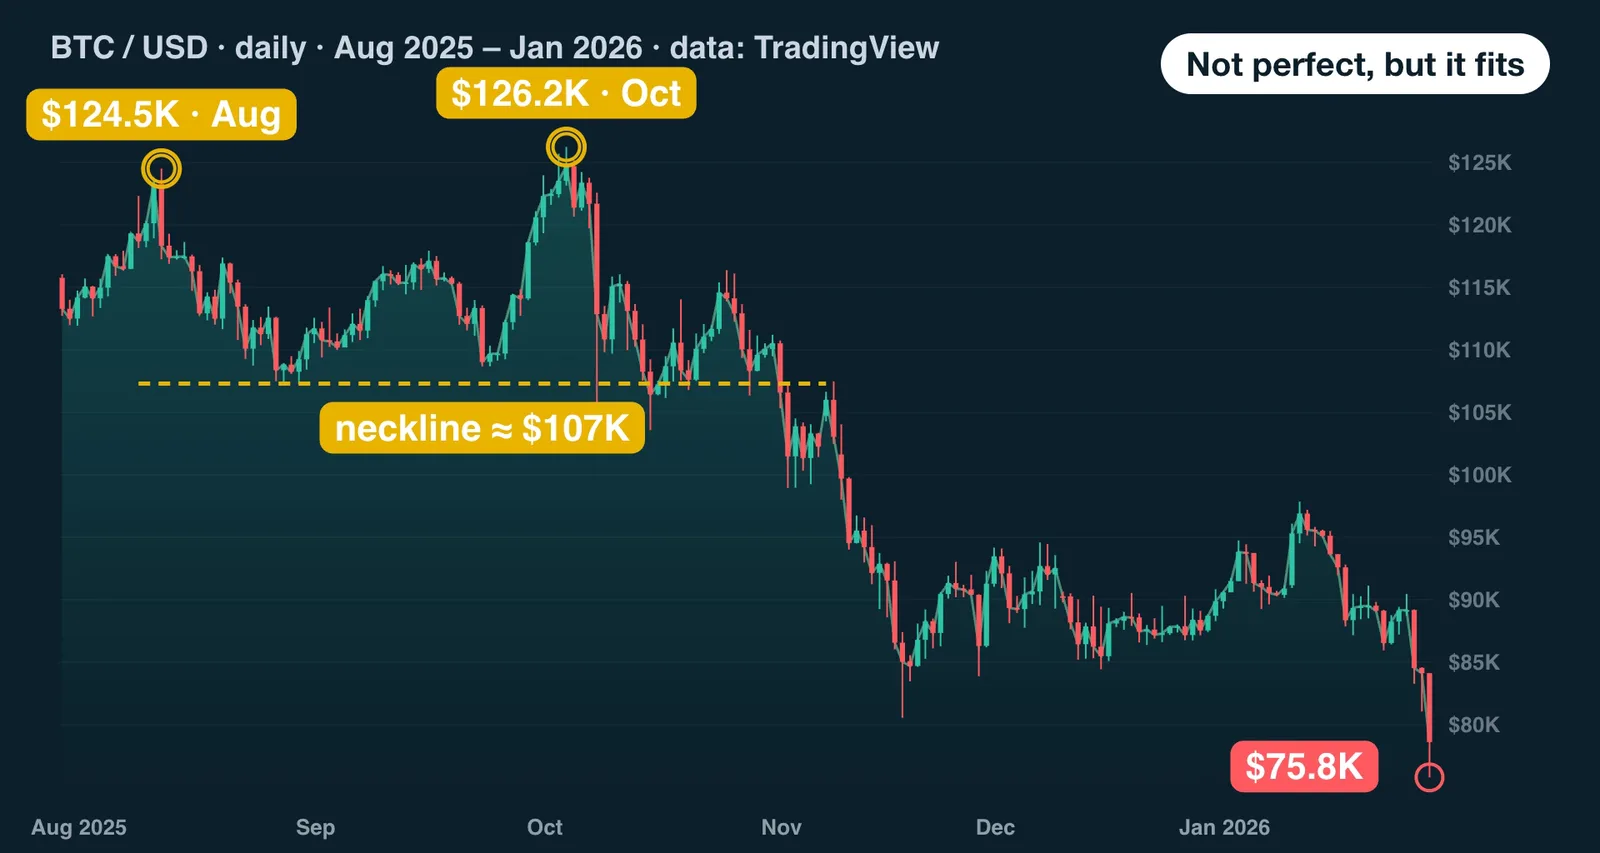
Look at the chart and judge for yourself. Two peaks, $124,501 in mid-August and $126,230 in early October, less than 1.5% apart. Between them, a dip to about $107,300. Price dipped below that level in October, bounced, then broke below it for good in early November and kept falling, all the way to $75,787.
It isn't a perfect double top pattern, but it fits, and it played out. GPT and Grok weren't wrong to say "no clear pattern": the prompt asked them to say so. But Claude gave the most useful read, and it named the same pattern both times. Kimi named two different patterns for the same chart.
Round 3 goes to Claude.
So which is the best AI for chart analysis?
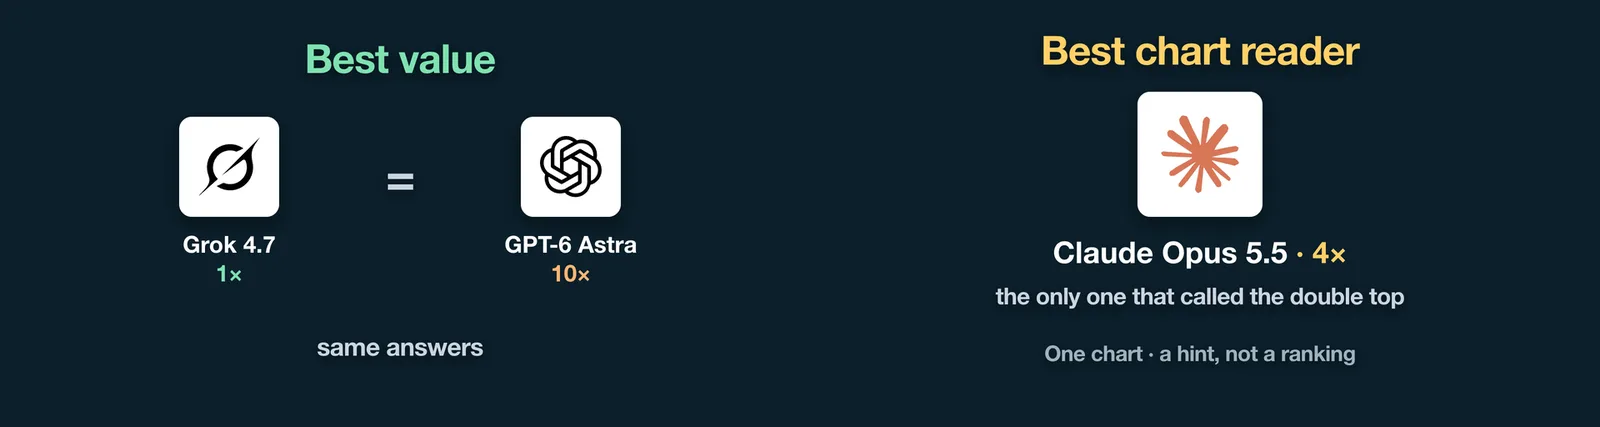
- Best value: Grok 4.7. The cheapest model in the test, at 1×, and it matched GPT-6 Astra at 10× in every round. Grok vs GPT on this chart was a tie, at a tenth of the credit rate. Grok was just slower on RSI.
- Best chart reader: Claude Opus 5.5, at 4×. Right on the basics and RSI, and the only one that called the double top.
It's one chart, so take it as a hint, not a ranking.
Three things we learned
- Paying the most didn't buy the best answer. The 10× model was matched by the 1× model and out-read by the 4× one.
- Check that the AI reads the chart you're looking at. Kimi's wrong RSI and the "low" that matched today's price both came from other numbers on the page.
- Ask about patterns twice. If the answer changes, don't trust it.
How to run this yourself
- Install SurfMind in your browser. It works in Chrome, Edge, Firefox, Safari, Brave, Opera and Arc.
- Open your chart: TradingView, your broker, anything in the browser.
- Open SurfMind's side panel and click the book icon in the message box (Enable read active page), so the model can look at the page.
- Ask your question. Use Compare answer with… to see a second model's answer side by side.
Limits of this test
- One chart, a few questions. Treat it as a snapshot, not a ranking.
- "Double top" is a judgment call. We quote every answer above so you can judge them yourself.
- The page showed live values next to the past chart. That tripped up some answers; a chart without live values might give different results.
- Models change. These results are for the versions available on November 7, 2026.
- Reading isn't predicting. A model that reads a chart perfectly still can't tell you what happens next.
Charts by TradingView.
Open a chart and see what your favourite model says about it.
Recent posts
View all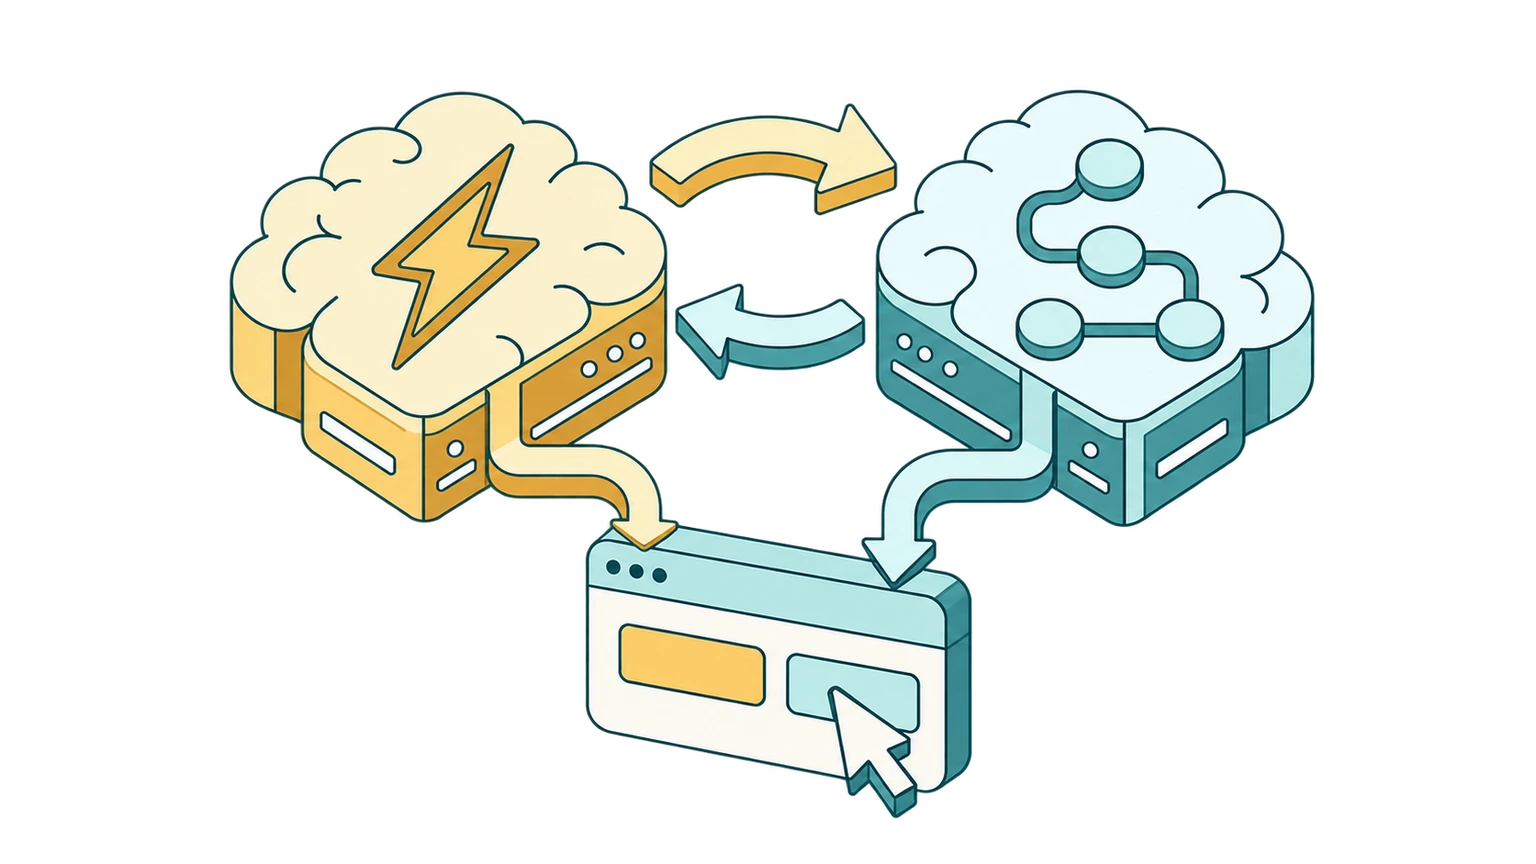
What Is an AI Decision Model? How Jev Makes Browser Automation 50x Cheaper
An AI decision model answers instead of writing text. Learn how System 1 vs System 2 thinking and models like Jev cut browser automation costs by up to 50x.
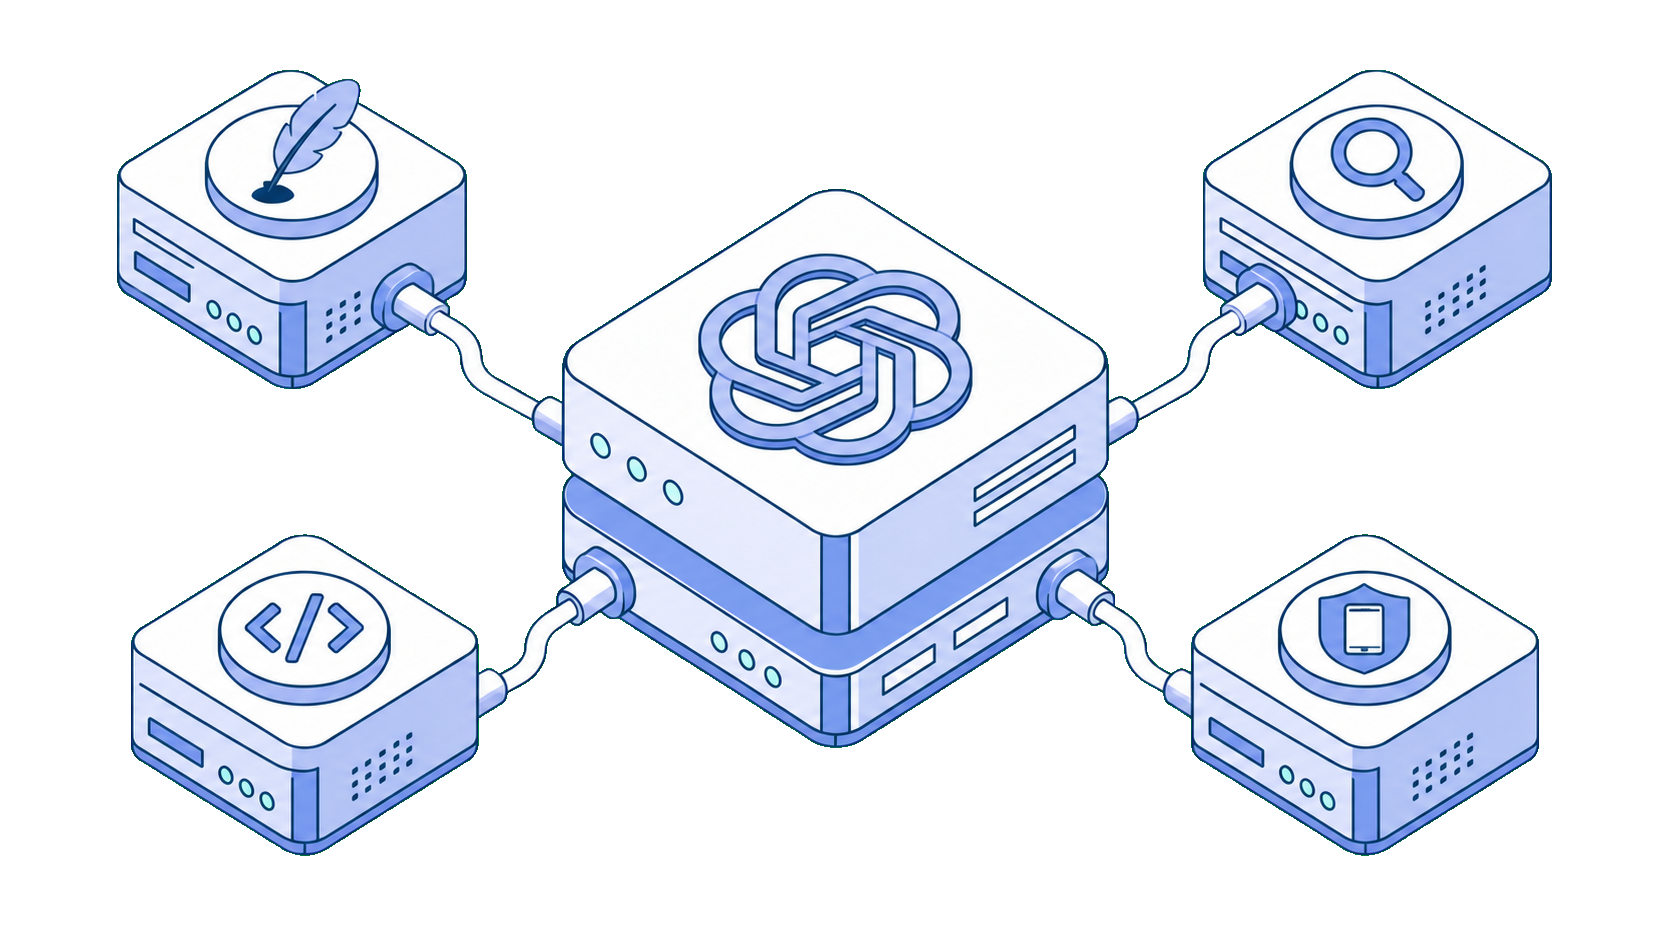
The Best ChatGPT Alternatives in 2026 (Most Are Free)
Looking for a ChatGPT alternative? Honest comparison of Claude, Gemini, DeepSeek, Perplexity, local models, and more, including free options and how to use them all without extra subscriptions.
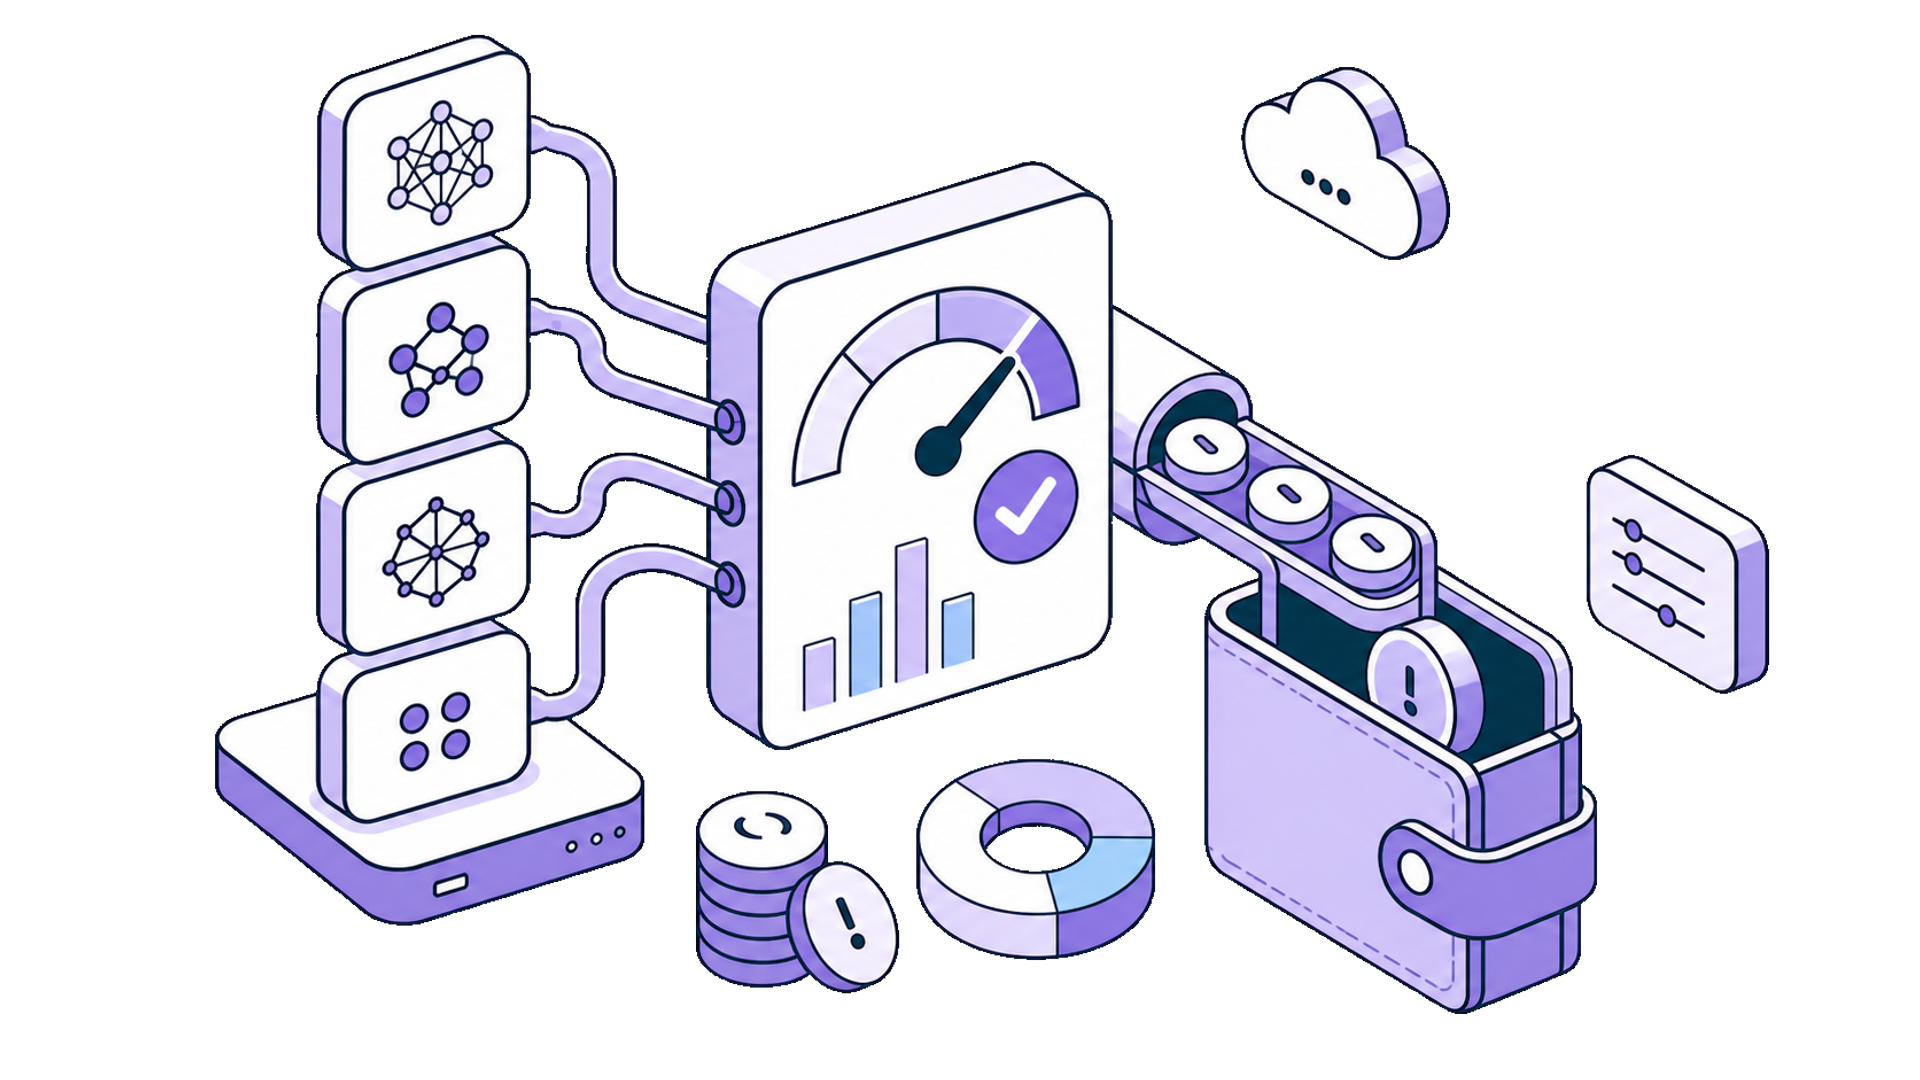
5 Ways to Get Claude/GPT Quality AI for Under $5/Month
Skip the $20/month subscriptions. Learn how to access top-tier AI models like Claude Sonnet 4.6, GPT-5.4, and Gemini 3 Flash for a fraction of the cost using BYOK and smart model selection.